For the occasion of the Embedded World exhibition in Nuremberg, which takes place from April 9th to April 11th, 2024, we are offering a new demo resulting from our work in embedded machine learning on the partner wall of the STMicroelectronics booth.
For the occasion of the Embedded World exhibition in Nuremberg, which takes place from April 9th to April 11th, 2024, we are offering a new demo resulting from our work in embedded machine learning on the partner wall of the STMicroelectronics booth.
Rtone has been developing its skills in embedded machine learning for a year now. As integrators specialized in the field of IoT, it is important for us to have the widest possible range of knowledge on potential application cases of embedded machine learning and technical solutions available from different market players.
We naturally turned to STMicroelectronics, particularly its Nano Edge Studio suite, which promises a rapid and guided implementation of ready-to-use algorithms for deployment without advanced knowledge in data science.
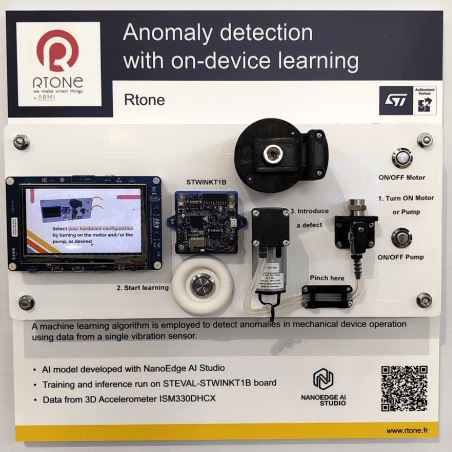
The objective of this demo is to show a practical case of self-learning for defect detection. The interest is to precisely adapt to the variations of the environment in which the device to be monitored operates. Here, we make a small engine and an air pump coexist, knowing that the vibrations generated by these two elements would disrupt and complicate classic detection based on measurement thresholds. The Machine Learning algorithm trained directly live on the model allows precisely determining the normal operating conditions of the system and detecting any anomalies, whether they come from the operation of the engine or the pump. Below you will find a video of the demo as well as a detailed technical description of the work carried out.
Demo Presentation
This demo implements a machine learning model to detect vibratory anomalies from a 3D accelerometer.
Vibrations are generated by 2 types of actuators:
An engine equipped with a magnetized device allowing the creation of a variable unbalance.
A pump equipped with an air hose whose flow is controlled by a tap.
The demonstration begins with the starting of a single actuator, followed by the learning of this specific configuration.
The learning takes place in real time on the MCU and includes 50 signals.
The manipulation of the running device leads to anomaly detection.
New learning can be carried out to reinforce the learning data of the existing model.
When the second actuator is activated, it generates vibratory disturbances that also trigger anomaly detection.
New learning allows learning this new configuration.
Manipulating one of the 2 devices leads to anomaly detection.
Data
Board: STEVAL-STWINKT1B (for training and inference) Sensor: 3D accelerometer ISM330DHCX Sampling frequency: 3.3KHz Resolution: 2G Number of axes: 3 Number of values per signal: 3*1024 Number of signals per sub dataset: 2*300 Number of sub datasets: 10 Total number of signals: 6000
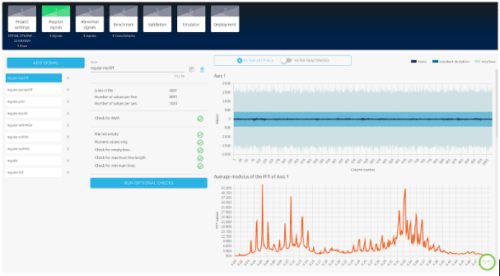
View of the normal signal data from NanoEdge AI Studio
Determining Signal Parameters
Initially, we choose initial parameters aimed at maximizing the information obtained in order to define the final parameters more precisely.
We configure the accelerometer at a maximum sampling frequency of 6667 Hz. The signals have a duration of 0.5 seconds to ensure the adequate capture of the physical elements necessary for anomaly detection.
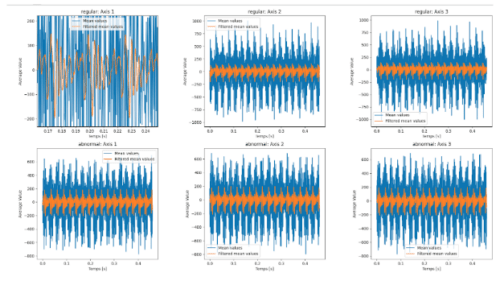
We display the average value of our signal samples.
We observe 17 physical elements, which can be reduced to about ten, leading to shortening the time span of our signals to 0.3 seconds.
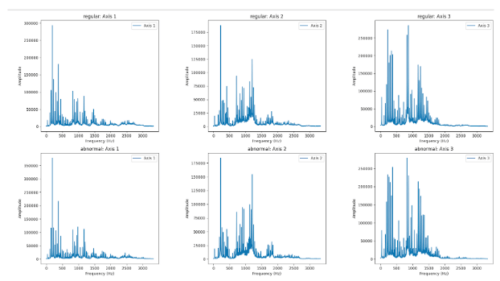
A Fourier transform is then applied to the signal samples, followed by calculating the average of the absolute values of the FFT result.
We observe frequencies with significant amplitude below 1.6 kHz. Consequently, the accelerometer’s sampling frequency is adjusted to 3.3 kHz.
Finally, we choose 1024 values per axis, each signal corresponding to a duration of 0.3 seconds at a sampling frequency of 3333 Hz.
Creating Sub Datasets
We select our subsets in order to cover all abnormal cases in 3 different situations (engine alone, pump alone, engine and pump).
The abnormal cases are kept relatively simple in order to find a model with good precision and not requiring too many learning iterations.
Nominal Case
Abnormal Case
Engine without unbalance
Engine OFF
Engine without unbalance
Unbalance at 50%
Engine without unbalance
Unbalance at 100%
Pump tap open
Pump OFF
Pump tap open
Tap closed at 75%
Pump tap open
Tap closed at 100%
Engine without unbalance and pump tap open
Unbalance at 50%
Engine without unbalance and pump tap open
Unbalance at 100%
Engine without unbalance and pump tap open
Tap closed at 75%
Engine without unbalance and pump tap open
Tap closed at 100%
Searching for a Machine Learning Algorithm
NanoEdge AI Studio is a self-ML solution that automatically finds the machine learning library best suited to our data.
A library consists of a signal processing algorithm, a machine learning model, and hyperparameters (parameters used for training the model).
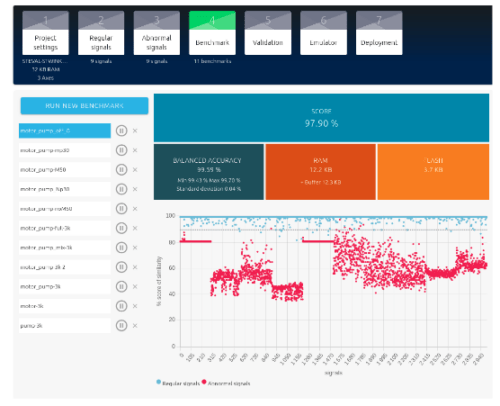
The Benchmark searches for the library that achieves the best performance in terms of accuracy and memory resources.
This step must be carried out methodically by adding one sub dataset after another. This makes it easier to identify the data that degrades the model’s performance.
Performance
RAM Memory: 24.5 KB Flash Memory: 3.7 KB Inference Time: 7 ms Signal Acquisition Time: 300ms Average MCU Consumption: 37 mA
Definitions
Axes:
The number of axes refers to the number of inputs used by the model, in our case, we have 3 axes corresponding to the x, y, z coordinates of the accelerometer.
Sample:
A sample corresponds to the instantaneous data from the accelerometer.
For one sample, we have one value per axis, so a total of 3 values.
Signal:
A signal contains samples from the accelerometer over a temporal sequence containing a physical phenomenon.
It is the data of this physical phenomenon that is exploited by the model for anomaly detection.
Sub dataset:
A sub dataset gathers the signals of normal and abnormal situations for a specific use case.
For example, one sub dataset can represent a vibratory anomaly generated by the pump and another for an anomaly generated by the engine.
Dataset:
The dataset gathers the data from all the sub datasets.
These data are used to train the model.
Un peu de lecture
Des articles, des podcasts, des webinars… et surtout des conseils pratiques ! En bref, une collection de ressources pour mener à bien votre projet.